Ecommerce Market Research: A Step-by-Step Guide for 2026
November 4, 2026

Most ecommerce market research fails before any data is collected. Teams open keyword tools, marketplace listings and ad libraries, gather pages of numbers, then argue about what those numbers mean. I'd reverse that order. Name the decision first, decide what evidence could change it, and only then start measuring.
Table of Contents
- The Six-Stage Ecommerce Research Process
- Size the Market With Public Benchmarks
- Score Niches Before You Pick One
- Map Competitors Across Every Channel
- Read Competitor Ad Activity as Signals
- Confirm Your Go or No-Go Decision
The Six-Stage Ecommerce Research Process
Businesses in 46 developed and developing economies recorded nearly $28 trillion in e-commerce sales in 2024, according to UN Trade and Development. Those economies together represent approximately three-quarters of global gross domestic product, and the measure includes domestic and cross-border business-to-business and business-to-consumer sales. Because economies without comparable data are excluded, the global total is higher.
That scale changes how you should research. Ecommerce isn't only storefront retail. It also includes wholesale transactions, procurement, marketplaces and other digitally ordered business activity. If you treat all online sales as one category, you'll mix consumer demand with business purchasing and produce a market size that looks precise but can't support a real decision. Segment by geography, transaction type, business size and domestic versus cross-border activity from the start.
The Working Sequence
| Stage | Question it answers | Output | Typical time |
|---|---|---|---|
| 1. Define the question | What decision the research supports | One-page brief | Half a day |
| 2. Size the market | Is the category large and growing | Benchmark table with ranges | 1 day |
| 3. Score niches | Which categories are worth a closer look | Scored shortlist | 2 days |
| 4. Map competitors | Who sells in the niche and through which channels | Competitor and channel map | 2 days |
| 5. Read ad activity | Who is spending now and how that is changing | Dated signal log | 1 to 2 days |
| 6. Decide | Go, wait or drop | Written decision with a trigger to revisit | Half a day |
The stages form a chain, not a checklist to complete out of habit. If the market is too small or shrinking, stop there. Don't spend days scoring niches inside a category you've already ruled out. If niche economics fail, competitor mapping won't rescue them. For a single niche, the full process takes roughly one to two weeks, assuming you work in order and drop weak options early.
Practical rule: Write the one-page brief before opening any tool.
That brief should name the decision, such as entering a niche, choosing a channel or pitching services to brands in it. It should also state what evidence would change your mind. Without that sentence, every new chart becomes an argument for continuing, and ecommerce market research turns into collection rather than judgement.
Size the Market With Public Benchmarks
Public benchmarks won't size your niche for you. They give you a disciplined starting point, a growth comparison and a way to spot claims that are plainly too large. Use them as boundaries, then narrow down with category evidence.
A Five-Step Sizing Method
- Define the category in buyer terms. Write "home fitness equipment" rather than "sports." A broad label pulls in products your buyer would never compare, and every later estimate inherits that error.
- Pull a benchmark for the market you'll sell into. The U.S. Census Bureau estimated seasonally adjusted retail e-commerce sales at $316.1 billion in the fourth quarter of 2025, equal to 16.6% of total retail sales. E-commerce sales increased 5.3% from the fourth quarter of 2024, while total retail sales increased 2.7% year over year. Use that online share as a penetration benchmark for U.S. retail, not as a figure for your niche.
- Compare at least eight quarters. A single quarter can mislead, especially the fourth quarter when consumer demand concentrates. Eight quarters show whether growth is steady, seasonal or fading, and they stop you from annualising a holiday spike.
- Separate consumer sales from business sales. Check whether the category is mostly business-to-consumer or also includes wholesale and procurement. Business purchasing can outweigh storefront sales, so a combined figure may describe buyers you can't reach with a consumer store.
- Record a range with assumptions beside it. Write the geography, category definition, channel scope and time period next to every estimate. A range with visible assumptions is more useful than a single number nobody can audit.
Use a Second Market as a Sanity Check
Japan gives you a useful comparison without forcing a currency conversion. Japan's domestic business-to-consumer ecommerce market reached 26.1 trillion yen in 2024, increasing 5.1% from 2023, according to Japan's Ministry of Economy, Trade and Industry. Keep the yen figure separate from U.S. dollars. Compare growth rates and definitions, not a converted total that implies the two series measure identical activity.
The common mistake is using total online retail to size a narrow niche. That inflates the opportunity and makes weak niches look viable. I'd set the threshold before you calculate. For example, require your category evidence to show growth above total retail growth before you move to niche scoring. If it doesn't clear that bar, pause and either redefine the category or drop it.
Score Niches Before You Pick One
Start with five to eight niches inside the category. Fewer than that and you're really just justifying a favourite. More than that and the scoring becomes shallow. Score each niche from 1 to 5, where 5 is favourable, and write the evidence behind every score in the same row.
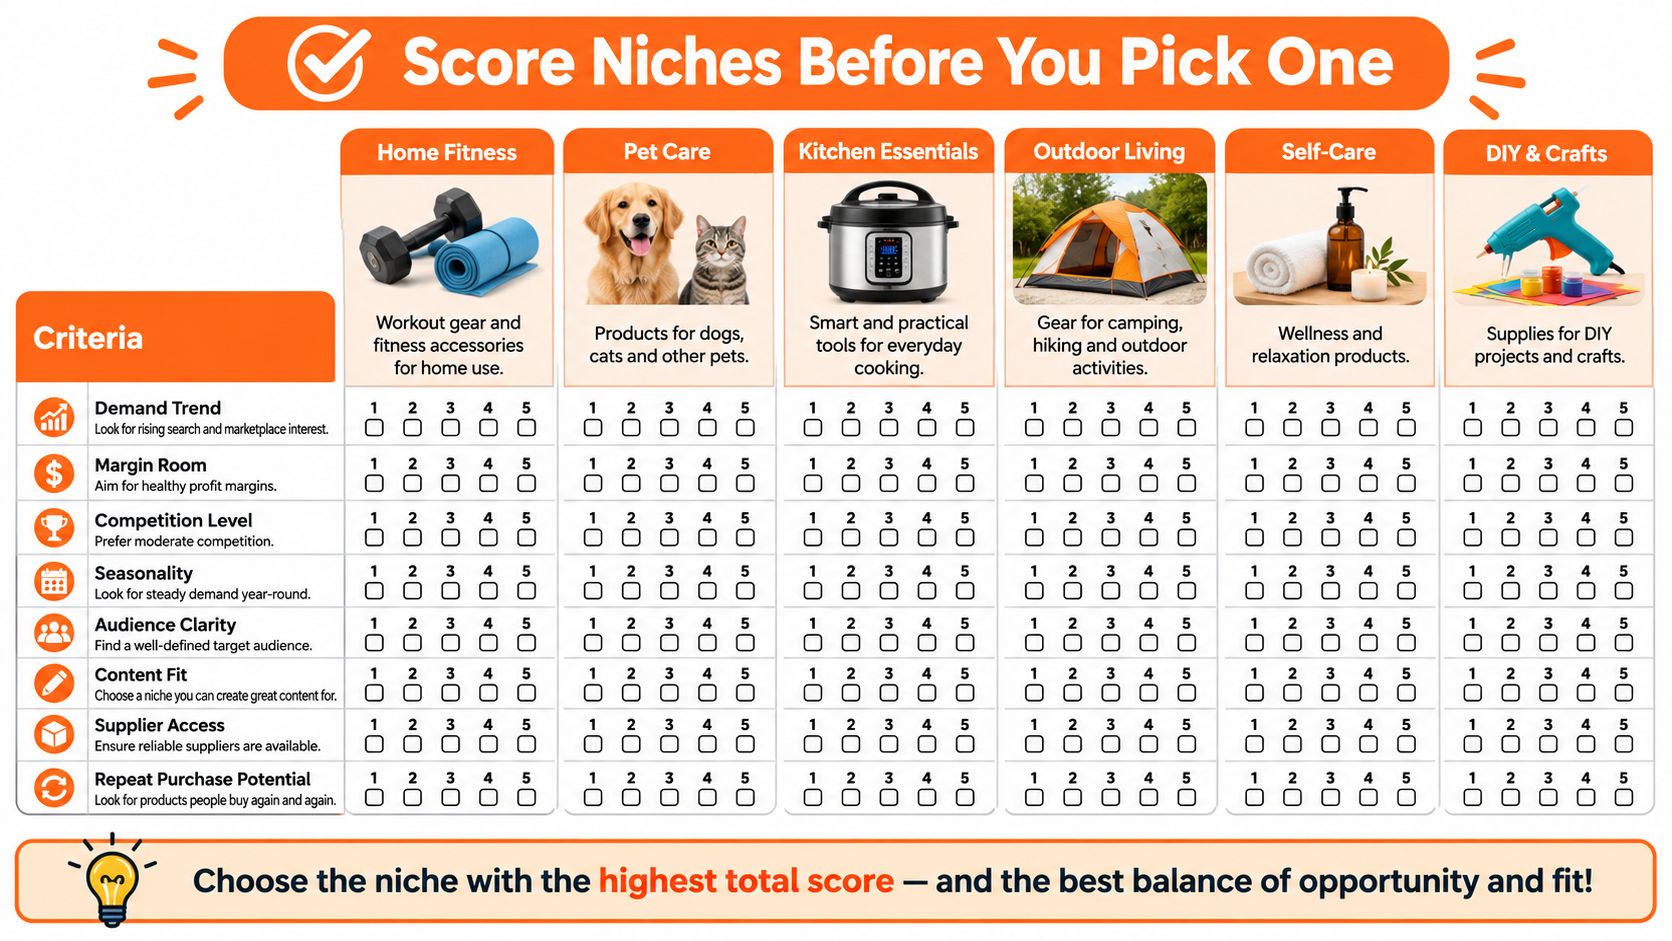
The Eight Criteria
- Demand trend: Is search and marketplace interest rising, flat or falling? Use Google Trends and keyword tools for direction, not as exact sales estimates.
- Margin room: Subtract landed cost, shipping and expected returns from the average selling price you see in marketplace listings. What's left has to cover acquisition and overhead.
- Competition density: How many brands are active in paid media? Use your ad logs here, because a crowded auction affects what traffic will cost.
- Repeat purchase: Consumables create a second chance to earn back acquisition cost. One-off products usually don't.
- Product and shipping risk: Score breakage, size, returns handling and regulation together. A fragile, bulky product can destroy an otherwise attractive margin.
- Creative needs: Does the product show clearly in short video? If buyers can't understand it quickly, you'll need more education and probably more creative testing.
- Seasonality: Mark how sharp the peaks are and how long the quiet periods last. A strong peak helps only if cash flow survives the trough.
- Differentiation: Can a new brand claim a distinct angle on outcome, audience, format or bundle? A vague quality claim isn't differentiation.
Why the Same Scorecard Reorders Niches
Say you're comparing pet supplements with a one-off kitchen gadget. The gadget may score well on creative fit because a short demonstration is easy to film. It may also have visible marketplace demand. But repeat purchase is weak, differentiation is hard once imitators copy the mechanism, and returns can rise if the demonstration overpromises.
Pet supplements are harder to explain and may face tighter product claims, so creative and risk scores could be lower. Yet repeat purchase can be stronger because owners replenish a product that fits a routine. If margin room survives landed cost, shipping and returns, that repeat behaviour can push supplements above the gadget even when the gadget looks more exciting in a feed.
Don't treat a high competition density score as automatically bad. Many active advertisers can confirm that buyers exist and that some brands can afford to keep buying traffic. It becomes a problem when you have no distinct angle and thin margin room. Competition confirms demand, but it doesn't grant you a share of it.
A niche that cannot cover landed cost, shipping and expected returns is out, whatever its other scores say.
Keep the top two niches for competitor mapping and ad analysis. Drop any niche that fails on margin room or shipping risk, even if demand looks strong. I'd rather carry two economically plausible options forward than spend the next stage studying competitors in a niche you shouldn't enter.
Map Competitors Across Every Channel
A competitor's own website is only part of its market presence. The ChannelEngine Marketplace Shopping Behavior Report 2026 found that 37% of shoppers begin product discovery on marketplaces, while 53% always or often compare the same product across multiple platforms and browse an average of three marketplaces before buying. If you only audit brand sites, you'll miss where comparison happens.
Pick five to seven competitors, including two that look weak. A struggling brand is useful because its pricing, offers and creative churn can show what isn't working. For each competitor, record price range, catalog size, main offers, new creative cadence and every channel where it sells or advertises.
Channels to Check for Each Competitor
| Channel | Where to look | What it reveals | Limit |
|---|---|---|---|
| Brand website | Homepage, product pages, offers | Positioning, price range, bundles | Shows claims, not sales |
| Marketplaces | Amazon, Etsy, Walmart listings and reviews | Price points, review counts, demand proxies | Review counts are partial signals |
| Short video and creators | TikTok, Instagram, YouTube | Content themes, creator volume | Engagement is not purchase |
| Paid search | Google search and Shopping results | Which brands bid on the keywords | Does not show budget size |
| Paid social ads | Meta Ad Library, Google Ads Transparency Center | Active creative, launches and stops | Ad volume is not profit |
| Search demand | Keyword tools and Google Trends | Demand direction over time | Estimates vary between tools |
Read each channel for what it can prove. Marketplace reviews can indicate accumulated buyer activity, but they don't reveal current sales velocity. Creator volume shows attention and content supply, not conversion. Paid search presence shows a brand values a keyword enough to bid, but it doesn't disclose budget or return. Keep those limits in the map itself, beside the observation, so a later reader doesn't upgrade a proxy into a fact.
AI-assisted shopping needs the same discipline. Don't automatically create a separate channel column and assign it full credit for a purchase. AI often changes the order of sources inside a multichannel journey, moving a shopper from a question to a marketplace comparison to a brand site. Your research should estimate duplicated discovery and channel influence instead of awarding everything to the final click. Post-purchase questions, search demand, marketplace visibility and referral data together give a better picture than any one source.
For a focused view of one store type, a list of Shopify stores running Facebook ads can help you identify which competitors are visibly active in paid social before you widen the map. Then check the other channels rather than assuming paid social is the whole strategy.
Finish with one row per competitor and one column per channel. Add a note on where each brand appears first in a typical journey. That first-appearance note matters because a brand discovered on a marketplace faces different comparison pressure from a brand discovered through creator content, even when both end up selling through the same store.
Read Competitor Ad Activity as Signals
Start with the two public sources that show live advertising directly. The Meta Ad Library and the Google Ads Transparency Center let you see active ads, launch dates and stops. They don't show spend, sales, margin or profit, and your notes should say so every time you draw a conclusion from them.
The image below shows the working setup for comparing those public ad sources side by side.
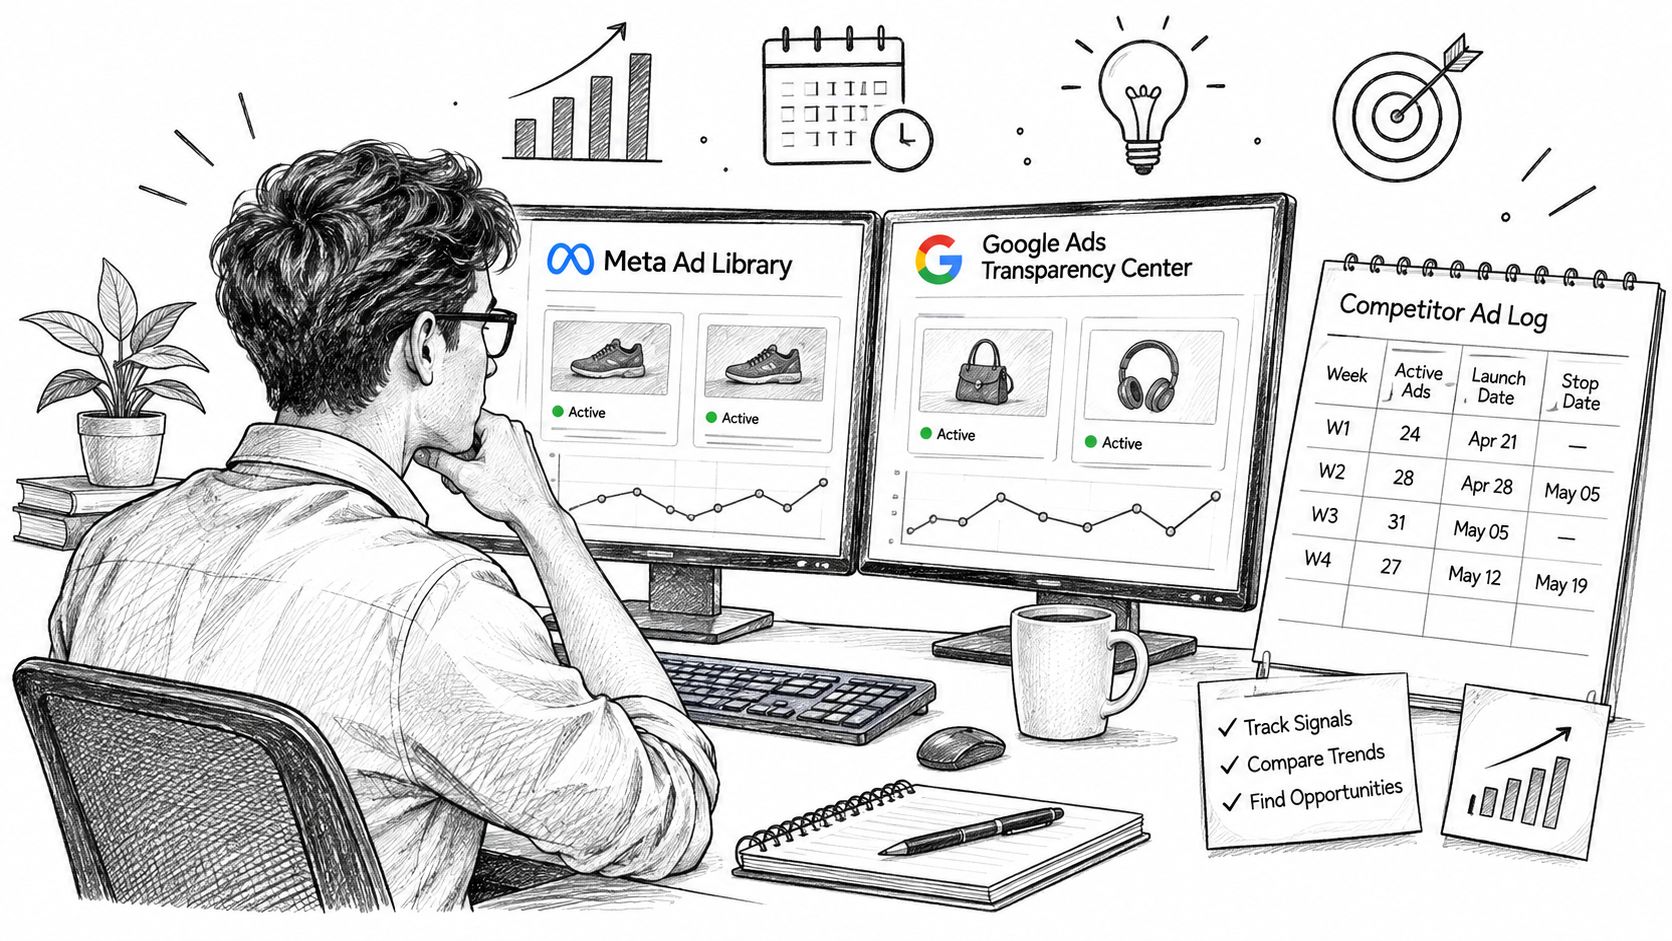
Build a weekly log for each competitor with three columns: visible ad count, first ad date and last ad date. Add the date you checked and a short note on creative angle or offer. Keep one sheet per niche so you can compare competitors side by side instead of judging one brand's burst in isolation.
Our data comes from the public Meta Ad Library, checked daily, with each advertiser matched to its online store. That daily matching matters because an advertiser name alone doesn't always tell you which store receives the traffic. For a manual starting point, a Facebook Ad Library scraper can export visible results so you can build the first version of the log without copying entries by hand.
Ad Activity Signals and What They Do Not Prove
| Signal | What it looks like | What it may suggest | What it does not prove |
|---|---|---|---|
| New advertiser | First visible ad in the last two weeks | A recent test or launch | Sales or profitability |
| Scaling | Live ad count rising sharply | A budget increase or a creative angle that works | Profit margin |
| Struggling | Frequent launches, few ads lasting past two weeks | Creative or offer testing that is not sticking | Financial distress |
| Stopped | Active ads drop to zero | A pause, a seasonal end or an exit | That the business failed |
A new advertiser may be testing one offer with a small budget. That's a reason to watch, not a reason to copy the product. A sharp rise in live ads may mean a creative angle is working, or it may mean the team is spending aggressively before economics are proven. Frequent short-lived launches suggest testing that isn't sticking, but they don't prove the business is in financial trouble. A drop to zero can be a pause, a seasonal end, a tracking change or an exit.
The video below walks through how to inspect competitor ads without treating visible volume as a sales report.
Watch each signal for two to three weeks before acting. A burst can be seasonal, tied to a promotion or limited to a small test budget. Duration is the filter. Ads that survive, multiply and keep a consistent angle deserve more weight than a busy weekend.
We don't include contact details in AdvertiserLeads. Brands can be exported to CSV so customers can find the right person with tools such as Clay or Apollo. That separation is healthy for research too. First establish what the advertising behaviour shows, then decide whether outreach or imitation is justified.
Recording rule: Write "signal of activity, not a measure of sales or profit" beside every ad reading.
Confirm Your Go or No-Go Decision
Bring together the four outputs you've produced: the market range, the niche scores, the competitor map and the dated signal log. Don't add a fresh round of browsing at this point. New anecdotes arriving during the decision meeting usually serve whoever argues loudest, not the evidence.
Set the Rule Before You Read the Results
- Go only if market growth beats total retail growth on the benchmark comparison you recorded.
- Require the niche to clear margin and shipping thresholds after landed cost, shipping and expected returns.
- Require at least two competitors to show scaling signals over three weeks in the ad log, so one brand's promotion can't carry the whole case.
Then name the trigger that would change the decision. It could be a leading competitor stopping its top ads, a sustained rise in marketplace reviews for a new entrant, or a price move that removes your margin room. Write the trigger beside the decision, with a date to check it. A decision without a revisit trigger becomes permanent.
If the rule is met, move to a 90-day test plan with a fixed budget cap and one primary measure of success, such as landed margin per order or cost per first purchase. One measure keeps the test honest. If you let the team switch between revenue, traffic and engagement depending on the week, every result can be described as progress.
If the rule fails on margin or shipping, drop the niche. Don't adjust the threshold after seeing the score. That single habit protects more money than any tool in the process. If the rule is partly met, mark the niche as wait, set a date to rerun the signal log and state exactly what needs to change.
AdvertiserLeads offers ecommerce leads, compare tools, niche reports, Shopify store lists, an Ad Library export, and free tools including a Facebook Ad Library scraper and a brand lookup. Signals can be combined with niche, ad volume, store platform and channels, and any search can be saved as an alert. That combination fits the wait decision well because you can monitor a niche without manually rebuilding the same search every week. The free brand lookup also lets you enter a store domain to check an individual brand before a review meeting.
If your next step is turning a validated niche into prospecting, the guide to ecommerce lead generation covers how to build lists from active brands rather than static store directories. Keep that work separate from the go or no-go call. A good prospect list doesn't prove a niche is worth entering.
This week, write the one-page brief for one niche and schedule the first two-week log review. Put the decision rule in a document, not in a chat thread. When the review date arrives, you'll either have evidence that meets the rule or a clear reason to stop.
When your ecommerce market research points to a niche worth pursuing, use AdvertiserLeads to find US ecommerce brands that have just started, are scaling, are struggling or have stopped advertising, then filter by niche, ad volume, store platform and channels. Save the search as an alert, export matching brands to CSV and time your outreach to visible advertising activity instead of guessing which stores are active.
Find brands that just started advertising
AdvertiserLeads checks the Meta Ad Library every day and flags ecom brands that just started, scaled or stopped their ads. Create a free account to see the live feed. No card.